Profile
Lukman Otunuga is a research analyst at FXTM. A keen follower of macroeconomic events, with a strong professional and academic background in finance, Lukman is well versed in the various factors affecting the currency markets.
Prior to joining FXTM, Lukman spent two years as a research analyst with international currency broker FXCM, where he focused on technical and fundamental analysis of the global currency, commodity and stock markets. Lukman was also responsible for leading educational seminars for international and local high net worth individuals, and has published a series of educational articles on forex trading with City A.M.

Lukman Otunuga –Research Analyst At FXTM
Lukman holds a BSc (hons) degree in Economics from the University of Essex, UK and an MSc in Finance from London School of Business and Finance, where he studied corporate finance, mergers & acquisitions and the role of international financial institutions.
The markets march to their own drumbeat and have their own rhythm and rhyme. Every serious trader can benefit from learning how the markets move in specific, repetitive, sometimes complex, patterns. This knowledge can shape a successful trading strategy and help identify more trading opportunities.
It all starts with time. Different aspects of time, beginning with the time zone and time of day. Certain times of day are critical for momentum, like market openings, when there is intense activity from traders coming online and taking positions. Market opens in London can trigger the most peaks and valleys for the Pound Sterling, for example. Tracking the distinct rhythm at market opens is a key part of understanding momentum and volatility.
London market open shows more volatility for cable
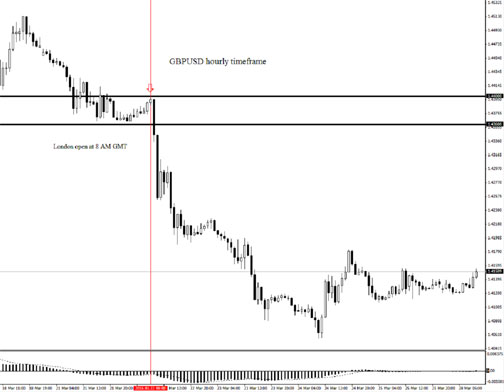
The second aspect is the time zone in which a trader is operating. Each currency, stock and commodity has its ‘home’ time zone; the Yen in the Asian time zone; the USD during the US trading session; or the Euro during the European session. Each half of a currency pair reacts more strongly during its ‘home’ zone trading session, making this another part of the market’s rhythm.
Frankfurt market open shows more volatility for the Euro
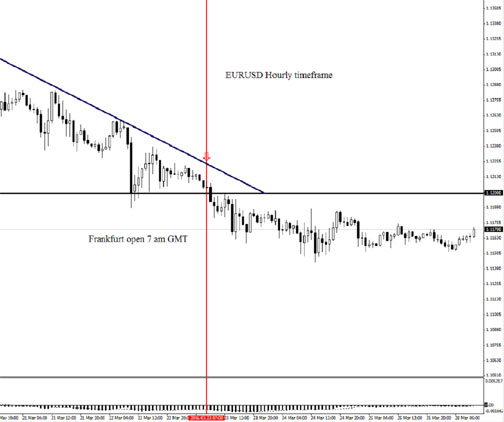
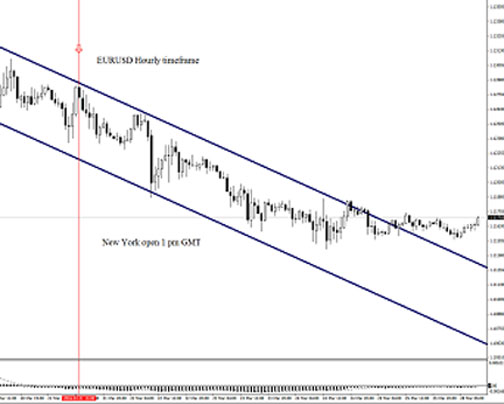
US Eastern Time crosses over between the European and US trading sessions, making it a faster buy-sell rhythm for the EURUSD. This is when New York wakes up and traders take their positions, often cuing from what happened earlier in the trading day.
EUR/USD reacts to new york market opening
Other assets like stocks and indices tend to peak or valley during their home trading sessions. The German DAX sees the most action during the European trading session; while the Nikkei moves according to buy-sell action during the Tokyo trading session. Local traders are the main drivers of the peaks and valleys seen by stocks and indices throughout the trading day in each time zone.
The DAX movements through the European trading day
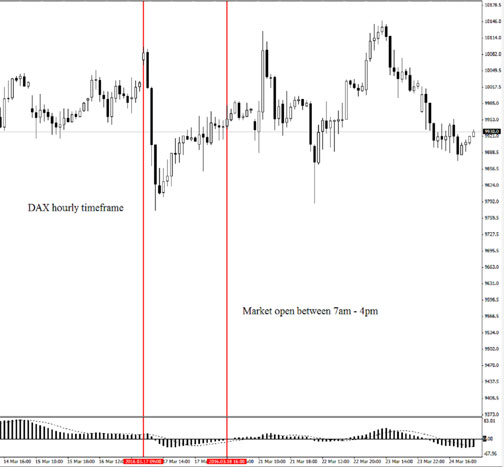
The end of each of the four trading time zones may be slower than the beginning, but it’s no less important to check your charts to see if the rhythm is holding steady or whether there are signs of it picking up again. This change could come from technical factors or from unexpected market news, like one of the massive investment houses moving assets around. Measuring the time between peaks and valleys goes a long way in establishing the market’s daily groove.
Price rhythms
Price trends don’t tend to happen in isolation from other market shapers like time zones, they move in harmony with each other, so it’s worth watching ‘the whole’ chart rather than just one indicator. Some technical oscillators stand out as key indicators of momentum such as the Stochastic Oscillator. Watch for the strongest signals in the Slow Stochastic moving averages at the bottom of the chart while observing peaks, valleys and time of day. This gives you the bigger picture – and rhythm – of the price trends for any given asset.
Let’s look at an example of all the market rhythms working together; price and time; the EURUSD at New York opening until the market close for the day.
EUR/USD from new york open to market close
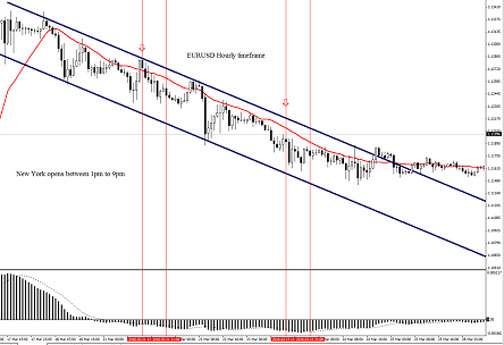
The EURUSD which was bearish on the hourly timeframe was trading within the daily bearish channel with the downside rhythm ensuring of consistent lower lows and lower highs. Although the European session offered a short term correction, this was swiftly erased in the New York session with enough downside momentum to send prices much lower. The breakdown after the third bearish candle successfully erased the gains from Europe and provided further encouragement for bearish investors to attack prices again. With the MACD trading to the downside the bearish rhythm may repeat itself once again in the new trading day once the New York session reopens.
In conclusion, traders who tune into the market’s rhythms and are able to observe the interactions between time and price can spot more opportunities and have a stronger foundation for their strategies.
 PAGE Blog Business Weekly Magazine

